Volume II, Book 1:
Scientific, Planning, Humanitarian, and Teaching Applications, From DevInfo to Google Earth
ASSESSMENT--AFRICA
| Africa | Asia
| Europe | Latin America | Northern America | Oceania |
 |
| The lists of available files from DevInfo for this region, filtered through various software packages including ESRI and Google Earth software, are given below (as they appear on the main Assessment page). For ideas of how to use them, please refer to the detailed, step-by-step, procedural guidelines farther down this page. The same strategy works for any region. |
| DevInfo Indicators Available:
Raw .apr Files:
|
| ArcView
3.2+ Edited .apr Files:
|
| ArcCatalog Projected Shape Files:
|
| ArcMap
9.2+ Set of Choropleth Maps from Shape Files: All
available indicators in a single file, mxd format
Raw .kml Files:
|
| Google Earth Edited .kml Files:
|
The animated figures below illustrate general visual sequences of software use. To see individual images, and figure captions for them supplying additional information, follow the link to the sequence of static shots associated with each animation.
|
SUMMARY OF CHAPTER CONTENT
SECTION 1: DEV
INFO
Figure 1.1: The goal here is to show the reader how to launch the DevInfo software, an associated database, and a set of indicators from the database. Figure 1.2: The goal here is to show the reader how to select time frames for analysis. Figure 1.3: The goal here is to show the reader how to select geographic regions for analysis. Figure 1.4: The goal here is to display the data selected for analysis of all indicators from Africa. Data is displayed both by country name and by indicator name. The latter display lets the user easily see which indicators have data associated with them. In this case, there are 8 different indicators: Maternal mortality
ratio
Prevalence of underweight (moderate and severe)--Percent, Total < 5 yr. Primary Completion Rate, Rate, Total Proportion of 1 year-old children immunised against measles, Percent, Total 1 yr Proportion of births attended by skilled health personnel, Percent, Total Proportion of population with access to improved sanitation, Percent, Total Proportion of population with sustainable access to an improved water source, Percent, Total Under-five mortality rate, Deaths per 1000 live births, Total Figure 1.5: Here the reader is taken through an entire sequence of steps for extracting data for a single indicator and making a map from it. The map is exported to ArcView .apr format to be opened in the next stage in ArcView 3.x. Repeat this process for each indicator for which there is data.
SECTION 2: ARC VIEW 3.2/3.3 Figure 2.1: The goal of this sequence of images is to show the reader how to open, in ArcView 3.2/3.3, one of the raw .apr files created in DevInfo. Figure 2.2: The goal of this sequence of images is to show the reader how to launch, in ArcView 3.2/3.3, extensions to ArcView. One is selected that will be used to merge the layers. It is called the "Geoprocessing" extension. Figure 2.3: The goal of this sequence of images is to show the reader how to use, in ArcView 3.2/3.3, the Geoprocessing extension to merge layers to a single shape file. Figure 2.4: The goal of this sequence of images is to show the reader how to retrieve, in ArcView 3.2/3.3, the database, or "Attribute File," associated with a single shape file. Figure 2.5: The goal of this sequence of images is to show the reader how to edit, in ArcView 3.2/3.3, the database, or "Attribute File," associated with a single shape file and to add a new blank data field (column). Figure 2.6: The goal of this sequence of images is to show the reader how to fill a database field, in ArcView 3.2/3.3, with data converted to "number" format suitable for using to create choropleth maps. Figure 2.7: The goal of this sequence of images is to show the reader how to create a database field, in ArcView 3.2/3.3, in "string" format suitable for creating date fields for the time slider in Google Earth. Figure 2.8: The goal of this sequence of images is to show the reader how to fill a database field, in ArcView 3.2/3.3, in "string" format suitable for creating date fields for the time slider in Google Earth. Figure 2.9: The goal of this sequence of images is to show the reader how to change entries in a database field, in ArcView 3.2/3.3, using the "edit" button. Frequent use will be made of the Windows universal commands, on highlighted text, of "ctrl +c" for "copy" and "ctrl +v" for "paste." Figure 2.10: The goal of this sequence of images is to show the reader how to stop editing entries in a database field, in ArcView 3.2/3.3, and save them. Figure 2.11: The goal of this sequence of images is to show the reader how to save and exit in ArcView 3.2/3.3.
SECTION 3: ARC CATALOG
SECTION 4: ARC
MAP 9.X
Figure
4.1: The
goal of this sequence of images is to show the reader how to create a
choropleth map (ranged fill by data interval) from the edited .apr file
extracted originally from DevInfo.
Figure 4.2: The goal of this sequence of images is to show the reader how to begin to generate a kml file for Google Earth from a choropleth map (ranged fill by data interval) from the edited .apr file extracted originally from DevInfo. Figure 4.3: The goal of this sequence of images is to show the reader how to complete the generation of a kml file for Google Earth from a choropleth map (ranged fill by data interval) from the edited .apr file extracted originally from DevInfo.
SECTION 5:
GOOGLE EARTH
Figure
5.1: The
goal of this sequence of images is to show the reader one way to edit
files in Google Earth so that coplanar polygons are eliminated.
Figure 5.2: The goal of this sequence of images is to show the reader one way to save files in Google Earth so that they appear in Google Earth when it is opened again after having been shut down. Figure 5.3: The goal of this sequence of images is to suggest other ways to edit and save files in Google Earth so that they appear in Google Earth when it is opened again after having been shut down. Figure 5.4: The goal of this sequence of images is to show how to open a kml file directly in Google Earth. In previous Figures, Google Earth Pro was launched. Here, the free Google Earth is used. The strategy for opening files is the same in either version.
|
SECTION 1: DEV
INFO
In
this software package, a "right-click" on the mouse (on a PC)
often brings up extra information and opportunity for software
use. Currently, it is in use in 81 developing
nations. For further information about this software, developed
by Kris S. Oswalt and team, see http://www.CommunitySystemsFoundation.org/
FIGURE 1.1: Link to sequence of static shots composing this animation. The goal here is to show the reader how to launch the DevInfo software, an associated database, and a set of indicators from the database.
 |
FIGURE 1.2: Link to sequence of static shots composing this animation. The goal here is to show the reader how to select time frames for analysis.
 |
FIGURE 1.3: Link to sequence of static shots composing this animation. The goal here is to show the reader how to select geographic regions for analysis.
 |
FIGURE 1.4: Link to sequence of static shots composing this animation. The goal here is to display the data selected for analysis of all indicators from Africa. Data is displayed both by country name and by indicator name. The latter display lets the user easily see which indicators have data associated with them. In this case, there are 8 different indicators:
Maternal mortality
ratio
Prevalence of underweight (moderate and severe)--Percent, Total < 5 yr.
Primary Completion Rate, Rate, Total
Proportion of 1 year-old children immunised against measles, Percent, Total 1 yr
Proportion of births attended by skilled health personnel, Percent, Total
Proportion of population with access to improved sanitation, Percent, Total
Proportion of population with sustainable access to an improved water source, Percent, Total
Under-five mortality rate, Deaths per 1000 live births, Total
 |
FIGURE 1.5: Link to sequence of static shots composing this animation. Here the reader is taken through an entire sequence of steps for extracting data for a single indicator and making a map from it. The map is exported to ArcView .apr format to be opened in the next stage in ArcView 3.x. Repeat this process for each indicator for which there is data.
 |
RESULTANT FILES:
|
SECTION 2: ARC
VIEW 3.2/3.3
This software is
Geographic Information System (GIS) software. The importance of
GIS is that maps and databases function in an interactive mode: a
change in the data produces a corresponding change on the map and
vice-versa. Thus, the process of mapping is transformed from a
static one to a dynamic one. This particular package, developed
by ESRI, is currently in use in many developing nations although not
still commonly in use in the U.S.A. and other locales.
FIGURE 2.1: Link to sequence of static shots composing this animation. The goal of this sequence of images is to show the reader how to open, in ArcView 3.2/3.3, one of the raw .apr files created in DevInfo.
 |
FIGURE
2.2: Link to sequence of static shots composing
this
animation. The
goal of this sequence of images is to show the reader how to launch, in
ArcView 3.2/3.3, extensions to ArcView. One is selected that will
be
used to merge the layers. It is called the "Geoprocessing"
extension.
 |
FIGURE
2.3: Link to sequence of static shots composing
this
animation. The
goal of this sequence of images is to show the reader how to use, in
ArcView 3.2/3.3, the Geoprocessing extension to merge layers to a
single shape file.
 |
FIGURE
2.4: Link to sequence of static shots composing
this
animation. The
goal of this sequence of images is to show the reader how to retrieve,
in
ArcView 3.2/3.3, the database, or "Attribute File," associated with a
single shape file.
 |
FIGURE
2.5: Link to sequence of static shots composing
this
animation. The
goal of this sequence of images is to show the reader how to edit, in
ArcView 3.2/3.3, the database, or "Attribute File," associated with a
single shape file and to add a new blank data field (column).
 |
FIGURE
2.6: Link to sequence of static shots composing
this
animation. The
goal of this sequence of images is to show the reader how to fill a
database field, in
ArcView 3.2/3.3, with data converted to "number" format suitable for
using to create choropleth maps.
 |
FIGURE
2.7: Link to sequence of static shots composing
this
animation. The
goal of this sequence of images is to show the reader how to create a
database field, in
ArcView 3.2/3.3, in "string" format suitable for creating date fields
for the time slider in Google Earth.
 |
FIGURE
2.8: Link to sequence of static shots composing
this
animation. The
goal of this sequence of images is to show the reader how to fill a
database field, in
ArcView 3.2/3.3, in "string" format suitable for creating date fields
for the time slider in Google Earth.
 |
FIGURE
2.9: Link to sequence of static shots composing
this
animation. The
goal of this sequence of images is to show the reader how to change
entries in a database field, in
ArcView 3.2/3.3, using the "edit" button. Frequent use will be
made of
the Windows universal commands, on highlighted text, of "ctrl +c" for
"copy" and "ctrl +v" for "paste."
 |
FIGURE
2.10: Link to sequence of static shots composing
this
animation. The
goal of this sequence of images is to show the reader how to stop
editing entries in a database field, in
ArcView 3.2/3.3, and save them.
 |
FIGURE
2.11: Link to sequence of static shots composing
this
animation. The
goal of this sequence of images is to show the reader how to save and
exit in
ArcView 3.2/3.3.
 |
RESULTANT FILES:
|
SECTION 3: ARC
CATALOG
ArcCatalog is part of
the more recent ESRI ArcGIS. This particular piece of that
packages permits the projection of maps. The
shape files created from the .apr files in ArcView are not projected
files and therefore cannot be subjected to further analysis in more
modern GIS software. One must first project them.
FIGURE 3.1: Link to sequence of static shots composing this animation. The goal of this sequence of images is to show the reader how to project the shape files produced in Section 2 so that they might be further processed later in both ArcMap and in Google Earth.
. |
|
|
SECTION 4: ARC
MAP 9.X
FIGURE 4.1: Link to sequence of static shots composing this animation. The goal of this sequence of images is to show the reader how to create a choropleth map (ranged fill by data interval) from the edited .apr file extracted originally from DevInfo. Try right-clicking in selected places to find shortcuts, for example, in coloring the outline of symbols. This package is rich in detail.
. |
|
Set
of choropleth maps for all available indicators, mxd format
|
Download
and install "export shape to KML" plug-in for ArcMap 9.2 plus.
|
FIGURE 4.2: Link to sequence of static shots composing this animation. The goal of this sequence of images is to show the reader how to begin to generate a kml file for Google Earth from a choropleth map (ranged fill by data interval) from the edited .apr file extracted originally from DevInfo.
. |
FIGURE 4.3: Link to sequence of static shots composing this animation. The goal of this sequence of images is to show the reader how to complete the generation of a kml file for Google Earth from a choropleth map (ranged fill by data interval) from the edited .apr file extracted originally from DevInfo.
. |
|
|
SECTION 5:
GOOGLE EARTH
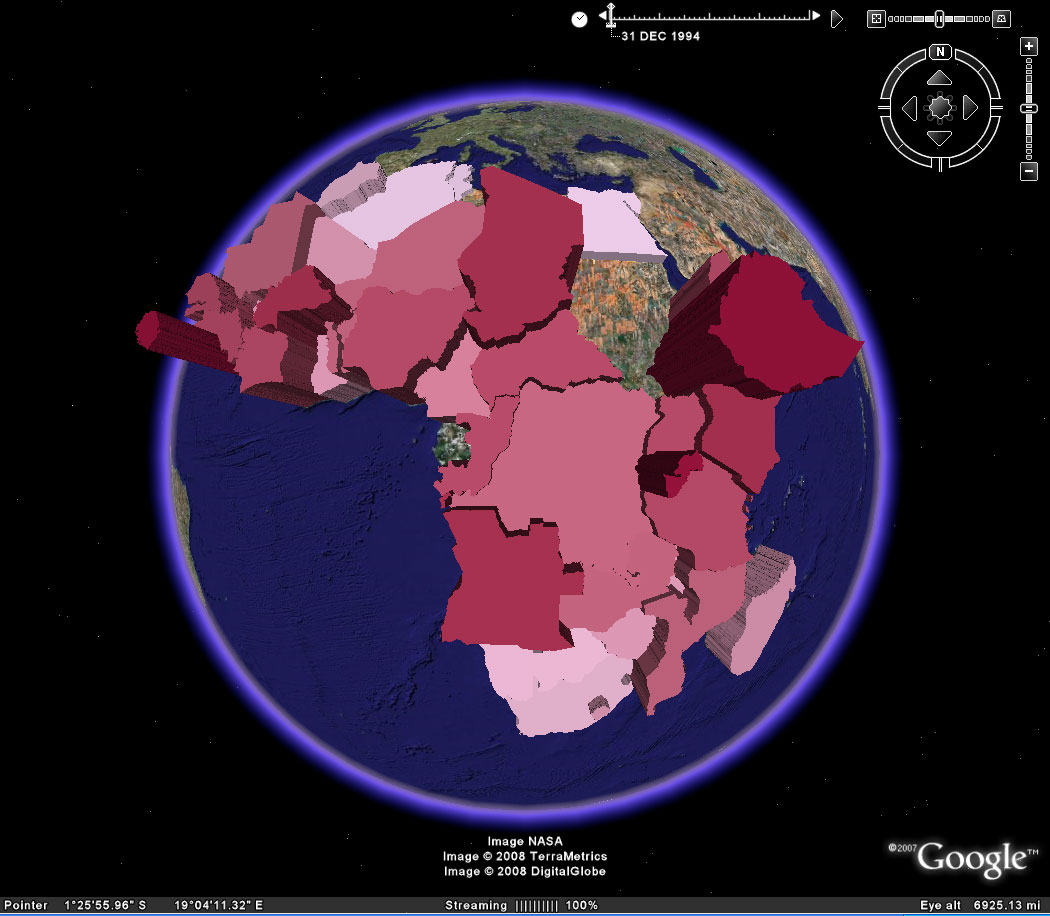
FIGURE 5.1: Link to sequence of static shots composing this animation. The goal of this sequence of images is to show the reader one way to edit files in Google Earth so that coplanar polygons are eliminated.
. |
FIGURE 5.2: Link to sequence of static shots composing this animation. The goal of this sequence of images is to show the reader one way to save files in Google Earth so that they appear in Google Earth when it is opened again after having been shut down.
.. |
FIGURE 5.3: Link to sequence of static shots composing this animation. The goal of this sequence of images is to suggest other ways to edit and save files in Google Earth so that they appear in Google Earth when it is opened again after having been shut down.
.. |
|
|
FIGURE 5.4: Link to sequence of static shots composing this animation. The goal of this sequence of images is to show how to open a kml file directly in Google Earth. In previous Figures, Google Earth Pro was launched. Here, the free Google Earth is used. The strategy for opening files is the same in either version.
.. |
TABLE OF CONTENTS
- INTRODUCTION: Assessment, Analysis, and Action--Community Systems Foundation Approach
- ASSESSMENT:
Software
used in analysis:
- DevInfo
5.0: http://www.devinfo.org/
- Adobe® PhotoShop and ImageReady
- Adobe® DreamWeaver
- ESRI:
- ArcView® 3.2
- ArcGIS® 9.2
- ArcCatalog®
- ArcMap®
- Google Earth®
Author
affiliations:
- Arlinghaus, Sandra Lach. Adjunct Professor of Mathematical Geography and Population-Environment Dynamics, School of Natural Resources and Environment, The University of Michigan. Executive Committee Member (Secretary) Community Systems Foundation, sarhaus@umich.edu, http://www-personal.umich.edu/~sarhaus/
- Naud, Matthew. Environmental Coordinator and Assistant Emergency Manager, Systems Planning Unit, City of Ann Arbor
- Oswalt, Kris S. President, Community Systems Foundation
- Rayle, Roger. Scio Residents for Safe Water
- Lars Schumann. Manager and
Research Computer Specialist, University of Michigan 3D Laboratory at
the Duderstadt Center; also of Cornell University, Ithaca NY
- Arlinghaus, William C. Professor of Mathematics and
Computer Science, Lawrence Technological University, Southfield, MI
- Arlinghaus, William E. General Manager, Chapel Hill Memorial Gardens, Grand Rapids, MI
- Batty, Michael. Bartlett Professor of Planning and Director of the Centre for Advanced Spatial Analysis (CASA) at University College London
- Haug, Robert. Ph.D. Candidate, Middle Eastern and
North African Studies, The University of Michigan
- Larimore, Ann Evans. Professor Emerita, Residential College, The University of Michigan
- Longstreth, Karl. Head, Map Library, The
University of Michigan
- Nystuen, Gwen L. Parks Advisory Commission;
Environmental Commission;
City of Ann Arbor
- Nystuen, John D. Professor Emeritus of Geography and
Urban Planning, Taubman College of Architecture and Urban Planning, The
University of Michigan. Chief Executive Officer, Community
Systems
Foundation
Published by:
Institute of Mathematical Geography
http://www.imagenet.org
http://deepblue.lib.umich.edu/handle/2027.42/58219
August, 2008.
Copyright by Sandra Arlinghaus, all rights reserved.