Volume II, Book 1:
Scientific, Planning, Humanitarian, and Teaching Applications, From DevInfo to Google Earth
ASSESSMENT--AFRICA
FIGURE 1.4: Animation. The goal here is to display the data selected for analysis of all indicators from Africa. Data is displayed both by country name and by indicator name. The latter display lets the user easily see which indicators have data associated with them. In this case, there are 8 different indicators:
Maternal mortality
ratio
Prevalence of underweight (moderate and severe)--Percent, Total < 5 yr.
Primary Completion Rate, Rate, Total
Proportion of 1 year-old children immunised against measles, Percent, Total 1 yr
Proportion of births attended by skilled health personnel, Percent, Total
Proportion of population with access to improved sanitation, Percent, Total
Proportion of population with sustainable access to an improved water source, Percent, Total
Under-five mortality rate, Deaths per 1000 live births, Total
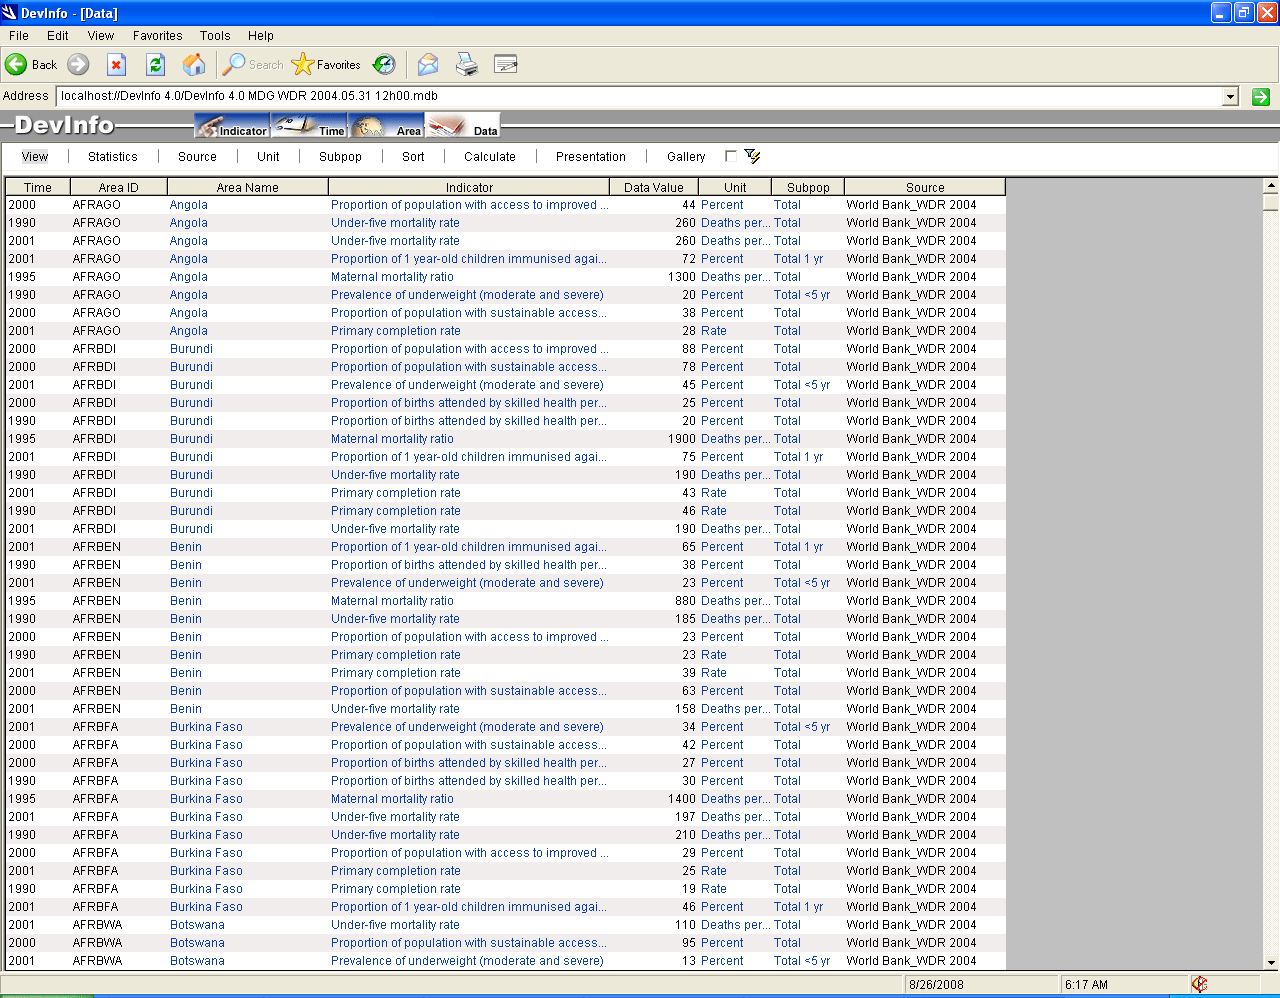 |
FIGURE 1.4: Static frames
of the animation. The goal here
is to display the data selected for analysis of all indicators from
Africa. Data is displayed both by country name and by indicator
name. The latter display lets the user easily see which
indicators have data associated with them. In this case, there
are 8 different indicators:
Maternal mortality
ratio
Prevalence of underweight (moderate and severe)--Percent, Total < 5 yr.
Primary Completion Rate, Rate, Total
Proportion of 1 year-old children immunised against measles, Percent, Total 1 yr
Proportion of births attended by skilled health personnel, Percent, Total
Proportion of population with access to improved sanitation, Percent, Total
Proportion of population with sustainable access to an improved water source, Percent, Total
Under-five mortality rate, Deaths per 1000 live births, Total
Prevalence of underweight (moderate and severe)--Percent, Total < 5 yr.
Primary Completion Rate, Rate, Total
Proportion of 1 year-old children immunised against measles, Percent, Total 1 yr
Proportion of births attended by skilled health personnel, Percent, Total
Proportion of population with access to improved sanitation, Percent, Total
Proportion of population with sustainable access to an improved water source, Percent, Total
Under-five mortality rate, Deaths per 1000 live births, Total
 |
 |
TABLE OF CONTENTS
- INTRODUCTION: Assessment, Analysis, and Action--Community Systems Foundation Approach
- ASSESSMENT:
Software
used in analysis:
- DevInfo
5.0: http://www.devinfo.org/
- Adobe® PhotoShop and ImageReady
- Adobe® DreamWeaver
- ESRI:
- ArcView® 3.2
- ArcGIS® 9.2
- ArcCatalog®
- ArcMap®
- Google Earth®
Author
affiliations:
- Arlinghaus, Sandra Lach. Adjunct Professor of Mathematical Geography and Population-Environment Dynamics, School of Natural Resources and Environment, The University of Michigan. Executive Committee Member (Secretary) Community Systems Foundation, sarhaus@umich.edu, http://www-personal.umich.edu/~sarhaus/
- Naud, Matthew. Environmental Coordinator and Assistant Emergency Manager, Systems Planning Unit, City of Ann Arbor
- Oswalt, Kris S. President, Community Systems Foundation
- Rayle, Roger. Scio Residents for Safe Water
- Lars Schumann. Manager and
Research Computer Specialist, University of Michigan 3D Laboratory at
the Duderstadt Center; also of Cornell University, Ithaca NY
- Arlinghaus, William C. Professor of Mathematics and
Computer Science, Lawrence Technological University, Southfield, MI
- Arlinghaus, William E. General Manager, Chapel Hill Memorial Gardens, Grand Rapids, MI
- Batty, Michael. Bartlett Professor of Planning and Director of the Centre for Advanced Spatial Analysis (CASA) at University College London
- Haug, Robert. Ph.D. Candidate, Middle Eastern and
North African Studies, The University of Michigan
- Larimore, Ann Evans. Professor Emerita, Residential College, The University of Michigan
- Longstreth, Karl. Head, Map Library, The
University of Michigan
- Nystuen, Gwen L. Parks Advisory
Commission; Environmental Commission;
City of Ann Arbor
- Nystuen, John D. Professor Emeritus of Geography and
Urban Planning, Taubman College of Architecture and Urban Planning, The
University of Michigan. Chief Executive Officer, Community
Systems
Foundation
Published by:
Institute of Mathematical Geography
http://www.imagenet.org
http://deepblue.lib.umich.edu/handle/2027.42/58219
August, 2008.
Copyright by Sandra Arlinghaus, all rights reserved.