APPLICATION
The following
files were provided to Ann Arbor City Planning Commission in
2006 as they considered drafting a floodplain ordinance. The main point here is to illustrate the added
capability that Google Earth® offers: to visualize, realistically, water
in relation to terrain, and to the built environment, at a
variety of geographical scales. That capability had not
been readily available in previous approaches.
The files that appear below show the extent to which water fills contours (in Google Earth®, the cursor position will also give elevation readouts, along with latitude and longitude, at the bottom of the screen if that option is enabled). Thus, these images mimick ponding effects: the images show where water accumulates according to topography. These models serve to illustrate Archimedes Principle of Displacement--the bathtub is filled to various levels--a simple blue plane segment was inserted at various elevations, as a level plane. Land above that elevation remains as is; at or below that elevation, it is covered with the semi-transparent blue plane, representing flooding.
In a flood situation, there is some of the Archimedes effect but there are numerous other effects that true hydrological modeling takes into account. Generally, runoff goes from high to low elevation so that there is a "natural flow" from the places farther from the river toward the river. That natural flow is movement; there is no movement in these models (one might imagine such, but it is not there). The pattern of movement might be influenced by a number of factors beyond elevation and gravity: local and prevailing winds, local variation in rainfall, soil permeability and saturation levels, and so forth. Other factors beyond natural climatic and topographic factors may also enter the picture. Amount of impervious surface may add extra ongoing directional effects (or, more generally, flow being channeled down steep streets toward gullies). One-time disasters, such as the failure of a dam may introduce "estuary" action from the flood surge going from the river upstream into a creek bed.
One suggestion for permitting development in the floodplain is to cut away the bank elsewhere, or create a constructed pond elsewhere, to account for any volume of water supplanted by a building in a floodplain. In terms of accounting for sheer volume, this solution appears attractive. When placed upstream from a proposed building site, one might imagine such a constructed pond as useful in providing extra detention in the natural flow as water moves from high to low elevation. One might question, however, what role an upstream pond would play when a estuary surge or a directional flow problem enters the picture and that problem enters downstream from the new building. When the water backs up to the level of the new building where there is now less volume, still the water may flow outside the existing floodplain and flood residential (or other) areas before reaching the level of the constructed pond designed to accommodate extra volume.

The material below introduces a 'flood' into the Allen Creek floodplain in Ann Arbor, Michigan. In it, water is imagined to enter the floodplain, shown above, from the Huron River. A level plane is inserted into Google Earth, with the 'terrain' switch on, at various elevations (measured as contours). In addition, buildings created as 3D models are also inserted. They, as well as terrain variation, will cause displacement of water. The simple Archimedean models offer one view of displacement related to the hypothetical flood; remember, these are models and models are not reality. The passage of time and the support of related field work, guided in part by evidence of models, will offer municipal authorities a gauge on planning development. What is reality is Archimedes Principle of Displacement. The laws of physics precede political and developmental concerns. They have endured and they will prevail.
Files from the 3D Warehouse to view in Google Earth® in conjunction with building files present in the List of Plates in this eBook (selected according to reader interest):
Water to the 900 foot
contour; 3D
model
Water to the 890 foot
contour; 3D
model
Water to the 880 foot
contour; 3D
model
Water to the 870 foot
contour; 3D
model
Water to the 860 foot
contour; 3D
model
Water to the 850 foot
contour; 3D
model
Water to the 840 foot
contour; 3D
model
Water to the 830 foot
contour; 3D
model
Water to the 820 foot
contour; 3D
model
Water to the 810 foot
contour; 3D
model
Water to the 800 foot
contour; 3D
model
Water to the 790 foot
contour; 3D
model
Water to the 780 foot
contour; 3D
model
Water to the 770 foot
contour; 3D
model
These files and others have been viewed by individuals from a variety of backgrounds. Nonetheless, what appears to be the case is that it is mainly individuals who already understand the issues who are most willing to study the files...in essence, preaching to the choir. To attempt to reach others (particularly those who do not have high-speed computer access or who are not comfortable using the internet), a variety of different visual effects involving simple animation and color overlays have been presented to municipal authorities. A few samples appear below. They are all based on files from 2006 displayed in contemporary software. As software changes over time, we hope that compatibility of files and loadsets also change in constructive ways.
The files that appear below show the extent to which water fills contours (in Google Earth®, the cursor position will also give elevation readouts, along with latitude and longitude, at the bottom of the screen if that option is enabled). Thus, these images mimick ponding effects: the images show where water accumulates according to topography. These models serve to illustrate Archimedes Principle of Displacement--the bathtub is filled to various levels--a simple blue plane segment was inserted at various elevations, as a level plane. Land above that elevation remains as is; at or below that elevation, it is covered with the semi-transparent blue plane, representing flooding.
In a flood situation, there is some of the Archimedes effect but there are numerous other effects that true hydrological modeling takes into account. Generally, runoff goes from high to low elevation so that there is a "natural flow" from the places farther from the river toward the river. That natural flow is movement; there is no movement in these models (one might imagine such, but it is not there). The pattern of movement might be influenced by a number of factors beyond elevation and gravity: local and prevailing winds, local variation in rainfall, soil permeability and saturation levels, and so forth. Other factors beyond natural climatic and topographic factors may also enter the picture. Amount of impervious surface may add extra ongoing directional effects (or, more generally, flow being channeled down steep streets toward gullies). One-time disasters, such as the failure of a dam may introduce "estuary" action from the flood surge going from the river upstream into a creek bed.
One suggestion for permitting development in the floodplain is to cut away the bank elsewhere, or create a constructed pond elsewhere, to account for any volume of water supplanted by a building in a floodplain. In terms of accounting for sheer volume, this solution appears attractive. When placed upstream from a proposed building site, one might imagine such a constructed pond as useful in providing extra detention in the natural flow as water moves from high to low elevation. One might question, however, what role an upstream pond would play when a estuary surge or a directional flow problem enters the picture and that problem enters downstream from the new building. When the water backs up to the level of the new building where there is now less volume, still the water may flow outside the existing floodplain and flood residential (or other) areas before reaching the level of the constructed pond designed to accommodate extra volume.
The material below introduces a 'flood' into the Allen Creek floodplain in Ann Arbor, Michigan. In it, water is imagined to enter the floodplain, shown above, from the Huron River. A level plane is inserted into Google Earth, with the 'terrain' switch on, at various elevations (measured as contours). In addition, buildings created as 3D models are also inserted. They, as well as terrain variation, will cause displacement of water. The simple Archimedean models offer one view of displacement related to the hypothetical flood; remember, these are models and models are not reality. The passage of time and the support of related field work, guided in part by evidence of models, will offer municipal authorities a gauge on planning development. What is reality is Archimedes Principle of Displacement. The laws of physics precede political and developmental concerns. They have endured and they will prevail.
Files from the 3D Warehouse to view in Google Earth® in conjunction with building files present in the List of Plates in this eBook (selected according to reader interest):
These files and others have been viewed by individuals from a variety of backgrounds. Nonetheless, what appears to be the case is that it is mainly individuals who already understand the issues who are most willing to study the files...in essence, preaching to the choir. To attempt to reach others (particularly those who do not have high-speed computer access or who are not comfortable using the internet), a variety of different visual effects involving simple animation and color overlays have been presented to municipal authorities. A few samples appear below. They are all based on files from 2006 displayed in contemporary software. As software changes over time, we hope that compatibility of files and loadsets also change in constructive ways.
 This animation represents the general filling of contours surrounding the Allen Creek bed in increments of 10 feet. Link to a movie in which the reader can control the animation rate. The 3D models of buildings are those from the previous chapter--cyan for University buildings and maize for downtown buildings. Not all buildings, throughout Ann Arbor, are modeled. |
 This animation takes a closer look at the file above. It shows, subtly, the difference between filling the contours to 810 feet and to 820 feet. Notice that some of the buildings have textures and some are modeled. These make convenient reference points for tracking the flood; textures or their lack does not influence displacement. Link to a movie in which the reader can control animation rate. |
 This animation shows more clearly the difference between filling contours to the 810 level and to the 820 level by employing contrasting colors for each level. |
The question remains:
Will municipal authorities in Ann Arbor permit building in floodplains?
Will municipal authorities in Ann Arbor permit building in floodplains?
The
image below shows a 2006 file loaded into Google Earth
from 2018. All buildings are now modeled by
Google and come as part of the default loadset.
Is there
accelerated runoff down Liberty Street toward the Allen Creek floodplain? One might ask a host of questions, suggested by varying viewpoints of the models.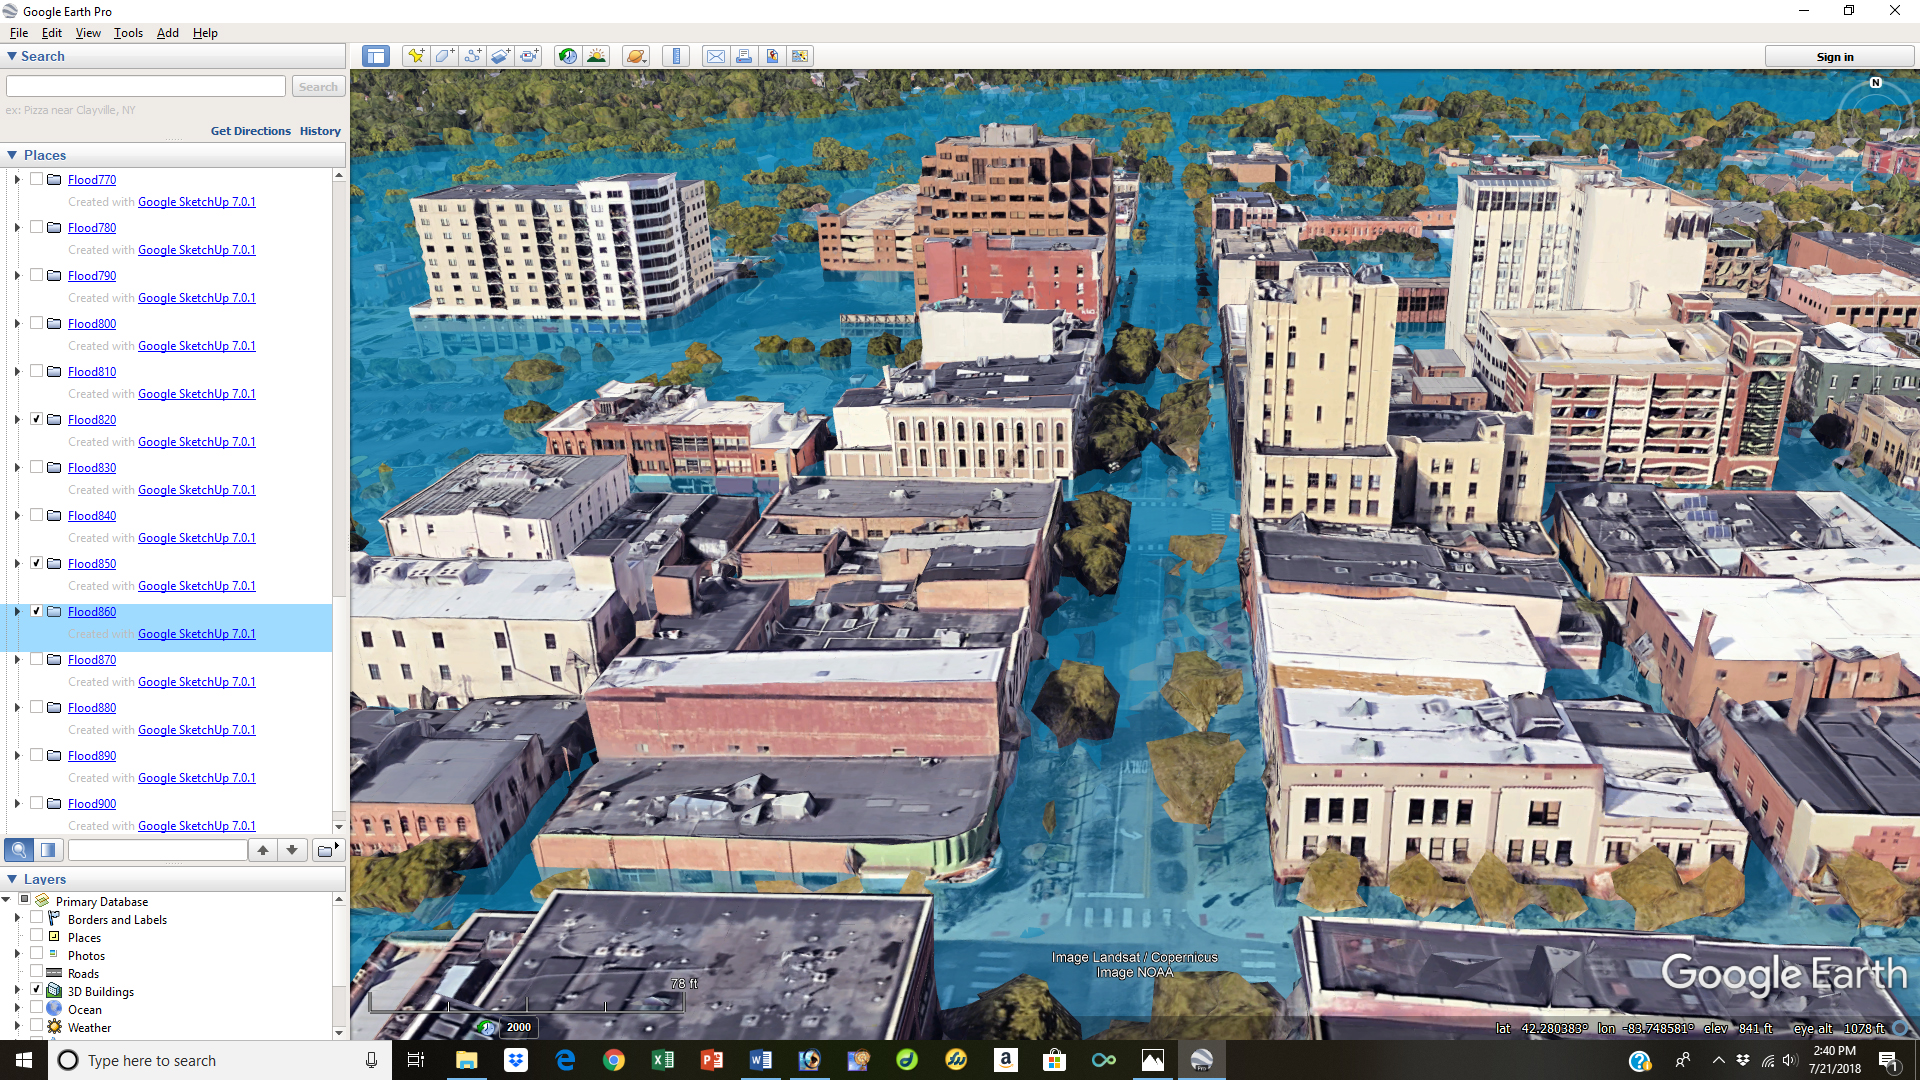
accelerated runoff down Liberty Street toward the Allen Creek floodplain? One might ask a host of questions, suggested by varying viewpoints of the models.
The
animation below, shows the 2006 level plane inserted
into a contemporary view in 2024. A significant
change that seems to be continuing over time, is that
Google models all the buildings and that these are
updated along with the software. Hence, there is no
need for an individual researcher to create models as
I did in 2006. Simply use the existing Google
Earth software, load the terrain and load the 3D
models that come on board. Then insert the level
plane where desired. Progress!
Copyright,
2006, All rights reserved. Contact arlinghaus@gmail.com
for permissions issues.