Mapping It Out!
A Contemporary View of Burgess's Concentric Ring Model of Urban Growth

Sandra L. Arlinghaus* and Daniel A. Griffith**

Download the associated .kmz file to open in Google Earth


      Our recent collaboration involving research on non-Euclidean fractals leads in a variety of directions, both "real" and "virtual."  In one case, we consider the expansion of urban growth pattern and analyze that expansion using fractal measures of the non-Euclidean Manhattan geometry.   One particular case, illustrating that urban application, employs the simple Burgess concentric ring model.  That model, originally cast in Chicago of the mid 1920s, sees a spread of population density outward from the center.  Figure 1 shows a characterization from those times (Park and Burgess, 1925).  While the ideas are straightforward to grasp, there is little indication in the schematic of where the model is anchored in terms of the real world.  The zone names give only general hints.  Phrases such as "Second Immigrant Settlement" are of little assistance.  The lead author grew up in Chicago, in the Hyde Park area on the south side (the University of Chicago neighborhood), and remembers the so-called "Black Belt" as centered on the north/south street called South Parkway (renamed later as Martin Luther King Drive), a bit to the west of Cottage Grove, the western boundary of Hyde Park.  Memories such as that are helpful but are not solid benchmarking evidence for this historical map.  Such benchmarking is important because without it, much historical material may become lost in the gap between paper and digital files.


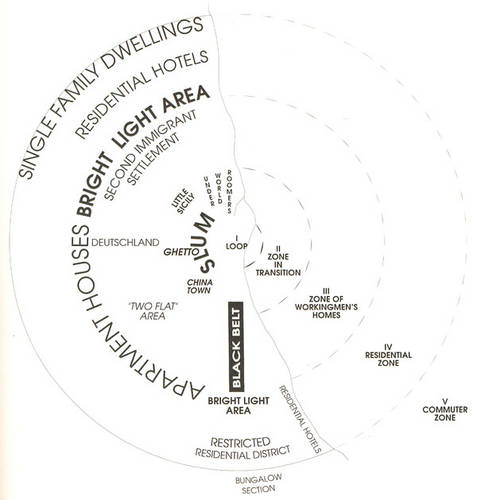
Figure 1.  Burgess Concentric Ring model of Chicago population patterns in the 1920s (Park and Burgess, 1925, p. 55).
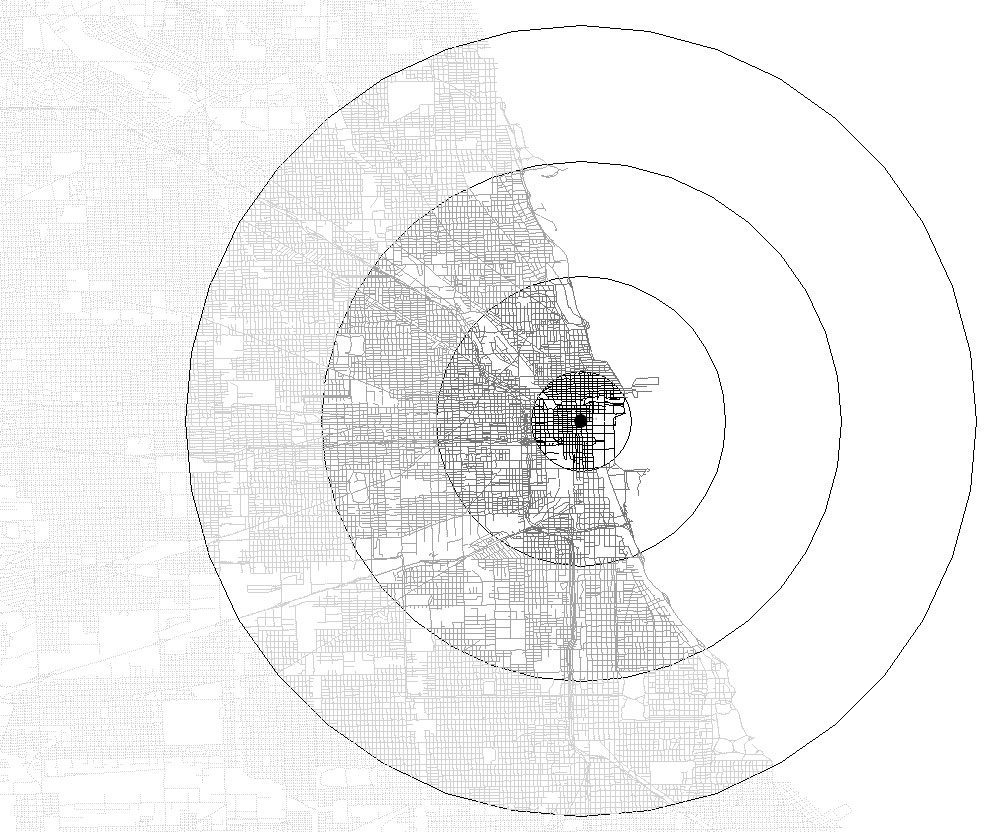
     Contemporary technology permits the easy mapping of all streets in Chicago simply by downloading Tiger files from the U.S. Bureau of the Census and opening them in GIS software (from ESRI, for example).  The map in Figure 2 shows the contemporary street pattern with Burgess rings inserted in appropriate positions.  A smaller version of this map is to appear in a conventional print journal.  In the associated article, we describe in text how to move from the historical map of Figure 1 to the contemporary map of Figure 2.  Mere description, however, falls far short of offering clear strategy for using fundamental spatial concepts to move across the digital divide.  Figures 3 and 4 below show the story of how cross that divide and to get from there (Figure 1) to here (Figure 2).


Figure 2.  Contemporary Tiger files of the Chicago street network overlain with Burgess concentric rings positioned as suggested in Figure 1.

     A search of the internet turned up a map of Chicago's Ganglands, from the 1920s, that identified "bright lights" areas on it in association with streets that exist today (Thrasher, 1923-1926).  The Bright Lights area on the south side of Chicago is clearly marked along 63rd Street, west of Cottage Grove.  This independent evidence from the times, using identical jargon, was the key to making an alignment of the Burgess model with actual maps as the Burgess model also mentions a "Bright Lights" area on the south (and north) side.  The animation in Figure 3 shows a sequence of overlays: the scanned portion of the Gangland map that covers Hyde Park and west serves as an overlay on the Google Earth globe.  It is aligned with Midway Plaisance (present on map and globe) and the scale of the imported image is adjusted to force street patterns, common to map and globe, to fit each other.  The fit is reasonable at a general view but is clearly far from a perfect fit.  There is no information on the map itself as to projection.   To take a closer look at the fit, Tiger files mapped in GIS software and exported from it to .kml format, are opened in Google Earth.  These files align with the roads in Google Earth and offer an opportunity to view 3D buildings and street scenes of today, captured in Google Earth, in association with that imported fine-mesh road network.  How nice it would be to imagine, as well, similar street scenes of yesteryear available within the software so that the Chicago of Burgess might come to life on the screen, as well.  Two independent contemporary sources fit each other.  Confidence in position of roads is secure.  The subsequent frames of the animation show the Bright Lights area along 63rd Street marked in the Gangland Map aligned with the Bright Light Area of the Burgess model of Figure 1.  The Black Belt area lies along South Parkway (Martin Luther King Drive) and one has confidence that the fit is reasonable; the model itself is very general so that one probably cannot expect ever to have a really accurate fit (as there is between Tiger and Google Earth files).  Because infill of Lake Michigan, to create new lands, has been a persistent strategy to enhance Chicago's spectacular lakefront, looking for coastal alignment over a time period of more than three quarters of a century is not as effective a strategy as is looking for street alignments.  That situation is contrary to many mapping alignment strategies that see hydro networks as more permanent than road networks.  Knowledge of particular planning or cultural practice can be critical in making good benchmarking decisions.

Figure 3.  Alignment of a Gangland map of the 1920s with Tiger files of today and the Burgess model of Figure 1, all superimposed as layers in Google Earth which permits the easy stretching of scanned images to fit the underlying Google Earth globe.

     Once one neighborhood fits, it is straightforward to repeat the process for more segments of the Gangland map.  This process is similar conceptually to using gores to fit a flat map onto a spherical globe.  When a good fit is known not to be present, as in this case, split the map into smaller pieces and align them with each other and with the base surface.  Smaller pieces produce smaller alignment errors than would larger ones.  The map is wrinkled at the alignment seams (that is, there is a bit of extra distortion along the seams).  Thus, one has choices to consider in cutting the map apart. Figure 4 shows the set of pieces used to create the entire Gangland map against which the full Burgess model is aligned, using primarily the Bright Lights areas, south and north, noted in both historical maps. 


Figure 4.  Insertion of flat Gangland map in Google Earth, aligned to underlying features, using the concept of "gores" or small sections reducing error in fit.
Once the Gangland map fits the Google Earth globe, it becomes easy also to align the entire Burgess model.  Figure 5 illustrates that alignment, first with an image using the full rings set to semi-opaque to facilitate alignment, and then with the less cluttered half-ring maps aligned to the full ring version.  From there, it is a simple matter to create corresponding rings in the GIS software, shade the underlying Tiger file road network according to ring position, and produce the Map in Figure 2.


Figure 5.  Alignment of the Burgess model with the Gangland map and therefore with Google Earth and associated Tiger files.

Figure 6 shows an interactive Google Earth model in which the reader may choose to zoom in and take a closer look at alignment procedures.  Alternatively, for full visibility, download the file from the link at the beginning of this article and load it directly into Google Earth.

Figure 6.   Interactive display subject to partial reader control.


     Contemporary technology, coupled with enduring concepts such as benchmarking, scale shift, and error reduction, made the action of mapping straightforward although perhaps a bit tedious with many steps.  What was critical was finding a map of the times [Thrasher] that showed actual location, in relation to streets, of regions noted on the Burgess model.  Once again the importance of good archiving of materials [University of Chicago Libraries], and their ready availability for research purposes online, is underscored.


References and Software:


Author Affiliations

*
Adjunct Professor of Mathematical Geography and Population-Environment Dynamics; The University of Michigan; School of Natural Resources and Environment; 440 Church St.; Ann Arbor, MI 48195; sarhaus@umich.edu

**Ashbel Smith Professor of Geospatial Information Sciences; University of Texas at Dallas; School of Economic, Political and Policy Sciences; 800 W. Campbell Road; Richardson, TX   75080-3021; dagriffith@utdallas.edu

Solstice:  An Electronic Journal of Geography and Mathematics
Volume XXI, Number 2
Institute of Mathematical Geography (IMaGe).
All rights reserved worldwide, by IMaGe and by the authors.
Please contact an appropriate party concerning citation of this article: sarhaus@umich.edu
http://www.imagenet.org
http://deepblue.lib.umich.edu/handle/2027.42/58219


IMaGe logo designed by Allen K. Philbrick from an original provided by the Founder. 
Solstice was a Pirelli INTERNETional Award Semi-Finalist, 2001 (top 80 out of over 1000 entries worldwide)

One article in Solstice was a Pirelli INTERNETional Award Semi-Finalist, 2003 (Spatial Synthesis Sampler).

Solstice is listed in the Directory of Open Access Journals maintained by the University of Lund where it is maintained as a "searchable" journal.

Solstice is listed on the journals section of the website of the American Mathematical Society, http://www.ams.org/
Solstice is listed in Geoscience e-Journals
IMaGe is listed on the website of the Numerical Cartography Lab of The Ohio State University:  http://ncl.sbs.ohio-state.edu/4_homes.html


Congratulations to all Solstice contributors.
Remembering those who are gone now but who contributed in various ways to Solstice or to IMaGe projects, directly or indirectly, during the first 25 years of IMaGe:

Allen K. Philbrick | Donald F. Lach | Frank Harary | William D. DrakeH. S. M. Coxeter | Saunders Mac Lane | Chauncy D. Harris | Norton S. Ginsburg | Sylvia L. Thrupp | Arthur L. Loeb | George Kish