Articles
The word clouds (formed in Tagxedo,
online) serve as a visual "abstract" of
the adjacent article!
Global
Singularity
In
Memory of David Barr
|
Sandra
L.
Arlinghaus
Introduction
Sculptor
David Barr was a longtime
friend of IMaGe (Institute
of Mathematical Geography)
and Solstice.
It is with sadness that we
note his recent passing but
it is with joy that we
remember him and his work
(Michigan Legacy Art
Park, 2016). From Barr's 'Four
Corners Project' and
'SunSweep' to the Solstice
articles
(Arlinghaus, Barr, and
Nystuen
1991;
Arlinghaus, 2009)
and IMaGe Monograph
(Arlinghaus
and Nystuen, 1986)
and eBook chapter
(Arlinghaus, 2008)
that Barr's
art inspired,
his imaginative
approach to the fine
arts was one that
meshed well with our
various projects and
interests.
His
approach was
singular,
yet
global.
In
Barr's memory, I
revisit work
done a while ago
(2008), and
bring forward
some of the
mathematical
and structural
concepts
behind
it.
Barr's
'Four
Corners
Project'
In
the late 20th
century, Michigan
sculptor David
Barr set out to
build an
Earth-sized
sculpture composed
of small granite
tetrahedra
representing the
vertices of an
abstract
tetrahedron
inscribed in the
Earth-sphere.
To realize the
concept, Barr
actually travelled
to four remote
locations and
planted the
granite corners
suggesting
terrestrial
protrusions of his
embedded giant
tetrahedron.
He began in Easter
Island, continued
to the Kalahari
Desert in southern
Africa, went to
the Greenland
icecap, and ended
up on a small
island just off
Irian Jaya/New
Guinea in
Indonesia.
His adventure,
which took many
years, is
chronicled in a
variety of places
including in film
shot by a crew
from the Archives
of American Art
(Smithsonian
Institution) that
traveled with him
(YouTube release,
2014).
It is an obvious,
and attractive,
idea to want to
visualize these
locations on a
globe. Using
Placemarks (icons)
positioned at the
sites of the four
corners on the
Google Earth globe
is perhaps a
natural
choice.
Figure 1 shows a
Placemark located
at the Easter
Island position on
that globe.
Figure 1.
Placemark on the
Google Earth globe
positioned at Barr's
Easter Island
vertex.
Original image from
2008 reference.
Original
source:
Institute of
Mathematical
Geography.
|
The
image in
Figure 1 gives
little context
to suggest the
sculpture.
To give
some context,
locate the
remaining
vertices and
add lines on
the surface of
the globe,
joining the
four
tetrahedral
prominences
(Figure 2).
Figure 2.
Placemark on the
Google Earth globe
positioned at Barr's
Easter Island vertex
with remaining
vertices placed on
the globe and lines
drawn joining them.
Original
image from 2008
reference. Original
source:
Institute of
Mathematical
Geography.
|
While
Figure 2
offers a
small amount
of added
context, it is
still
discouraging
not to be able
to see the
rest of the
vertices.
Global
Visualization:
The Importance
of
Transparency
In
Figure 3, the
image
of the Earth
is removed and
the four
corners appear
on the Google
Earth
globe:
the globe has
its skin
removed.
Transparency
replaces the
Earth-skin on
the Google Earth
globe.
Figure 3.
Placemarks for all
four of Barr's
corners come into
view on the Google
Earth globe once
transparency is
introduced.
Easter Island is in
the center of the
image.
Original
image from 2008
reference. Original
source:
Institute of
Mathematical
Geography.
|
Figure
4 shows an animation
produced by
rotating the
transparent Google
Earth globe
of Figure 3.
Figure 4.
Animation of Figure
3. Original
image from 2008
reference. Original
source:
Institute of
Mathematical
Geography.
|
A
natural next
step is to
introduce the
lines,
linking the
vertices, back
into the
image.
Thus,
Figures 5 and
6 show an
image sequence
to parallel
that of
Figures 3 and
4.
Figure 5.
Placemarks for all
four of Barr's
corners come into
view on the Google
Earth globe once
transparency is
introduced.
Lines suggest
linkage.
Easter Island is in
the center of the
image.
Original
image from 2008
reference. Original
source:
Institute of
Mathematical
Geography.
|
Barr
enjoyed using
these, and
related
images, in his
teachings and
in
communications
with others.
Figure 6.
Animation of Figure
5. Original
image from 2008
reference. Original
source:
Institute of
Mathematical
Geography.
|
John Nystuen
suggested that inserting an
outline map of the world
would add some extra
reference. Figure 7
shows that
arrangement. Note that
because Africa is on the
back side of the globe, it
appears 'inverted' from east
to west, as the reader is
looking through the
transparent globe at it.
n
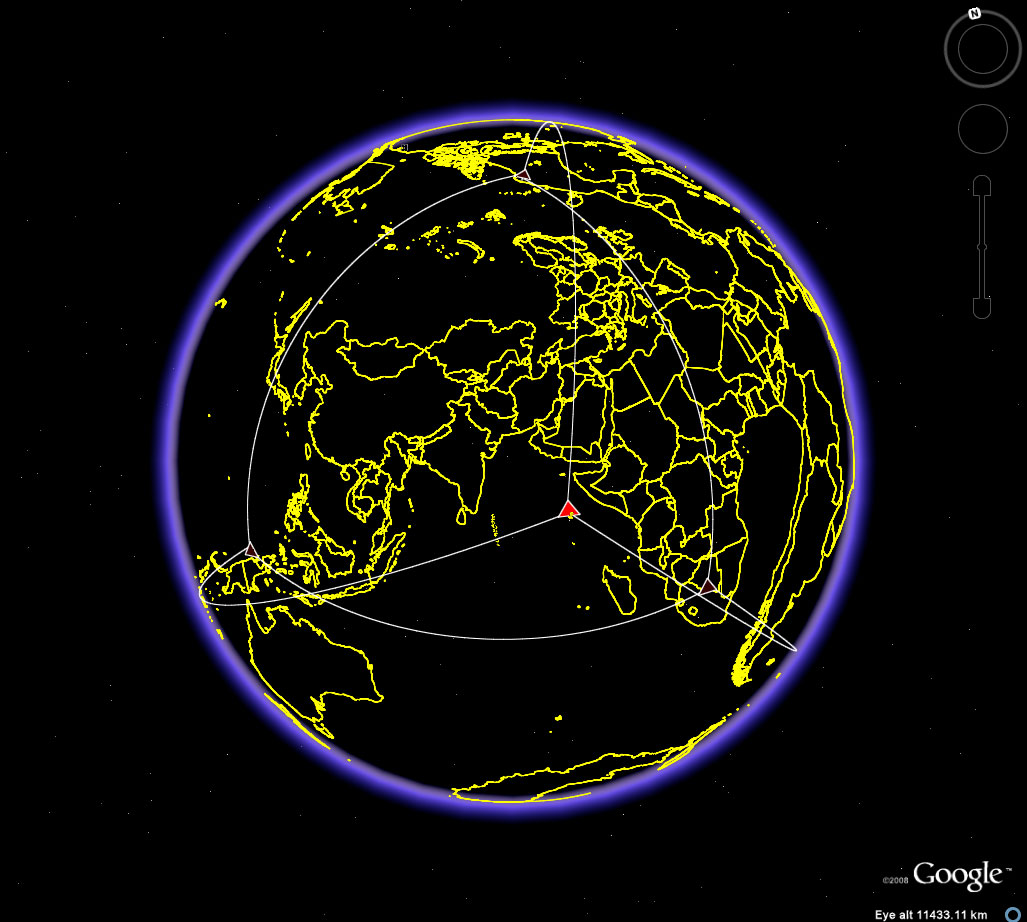
Figure 7.
Continental
and country outlines,
imported as a
shapefile, also show
through the
transparent
Earth-sphere.
Easter Island is the
bright red vertex
closest to the center;
the vertex to the left
and on the other side
of the globe is on
Irian Jaya. The
vertex in the Kalahari
Desert is on the back
side of the globe
(east/west pattern in
Africa is thus
inverted).
Original
image from 2009
reference. Original
source:
Institute of
Mathematical
Geography.
|
Singularity
on the
Globe:
Visualization
Unwrapped
The
casual user of
Google Earth
might wonder
how to make
the globe
become
transparent.
Indeed,
that is an
interesting
question.
To do so, I
used a version
of Google
Earth that was
released
in
2007.
Figure 8
illustrates
how I was able
to remove the
Earth-skin.
Notice that
there is no
check mark in
the 'Primary
database'
checkbox.
The
initial frame
of the
animation
shows Google
Earth with
continents,
oceans, and so
forth.
The second
frame shows
the graticule
placed on the
globe of continents.
The
third frame
shows highlighting
of the layer
'Primary database'
in the Layers
box on the
left. In
the fourth
frame, the
slider in the
'Places' box,
at the bottom,
is moved all
the way to the
left.
This sliding
action causes
the continental
skin to become
obscured
and reveals a
transparent
globe on which
the graticule
is evident all
around the
globe.
Figure
9. Removing the
continental skin from
the Google Globe to
reveal the underlying
transparent
globe. Original
image from 2008
reference.
Original
source:
Institute of
Mathematical
Geography. |
Another
question I have been
asked is 'how did
you decide to do
things this way and
figure out what to
do'? One
source of questions
such as these came
up in response to a
poster displayed at
presented
at the first "Scientific
Applications
with Google
Earth
Conference,"
October 22-23,
2008, at The
University of
Michigan, Ann
Arbor (Figure
10). (Link
to
full-sized
poster
presented by
the author; link to
poster with
embedded
links.)
It appeared
that several
scholars
present at
that
conference
also saw value
in being able
to use the
globe without
the
continents!
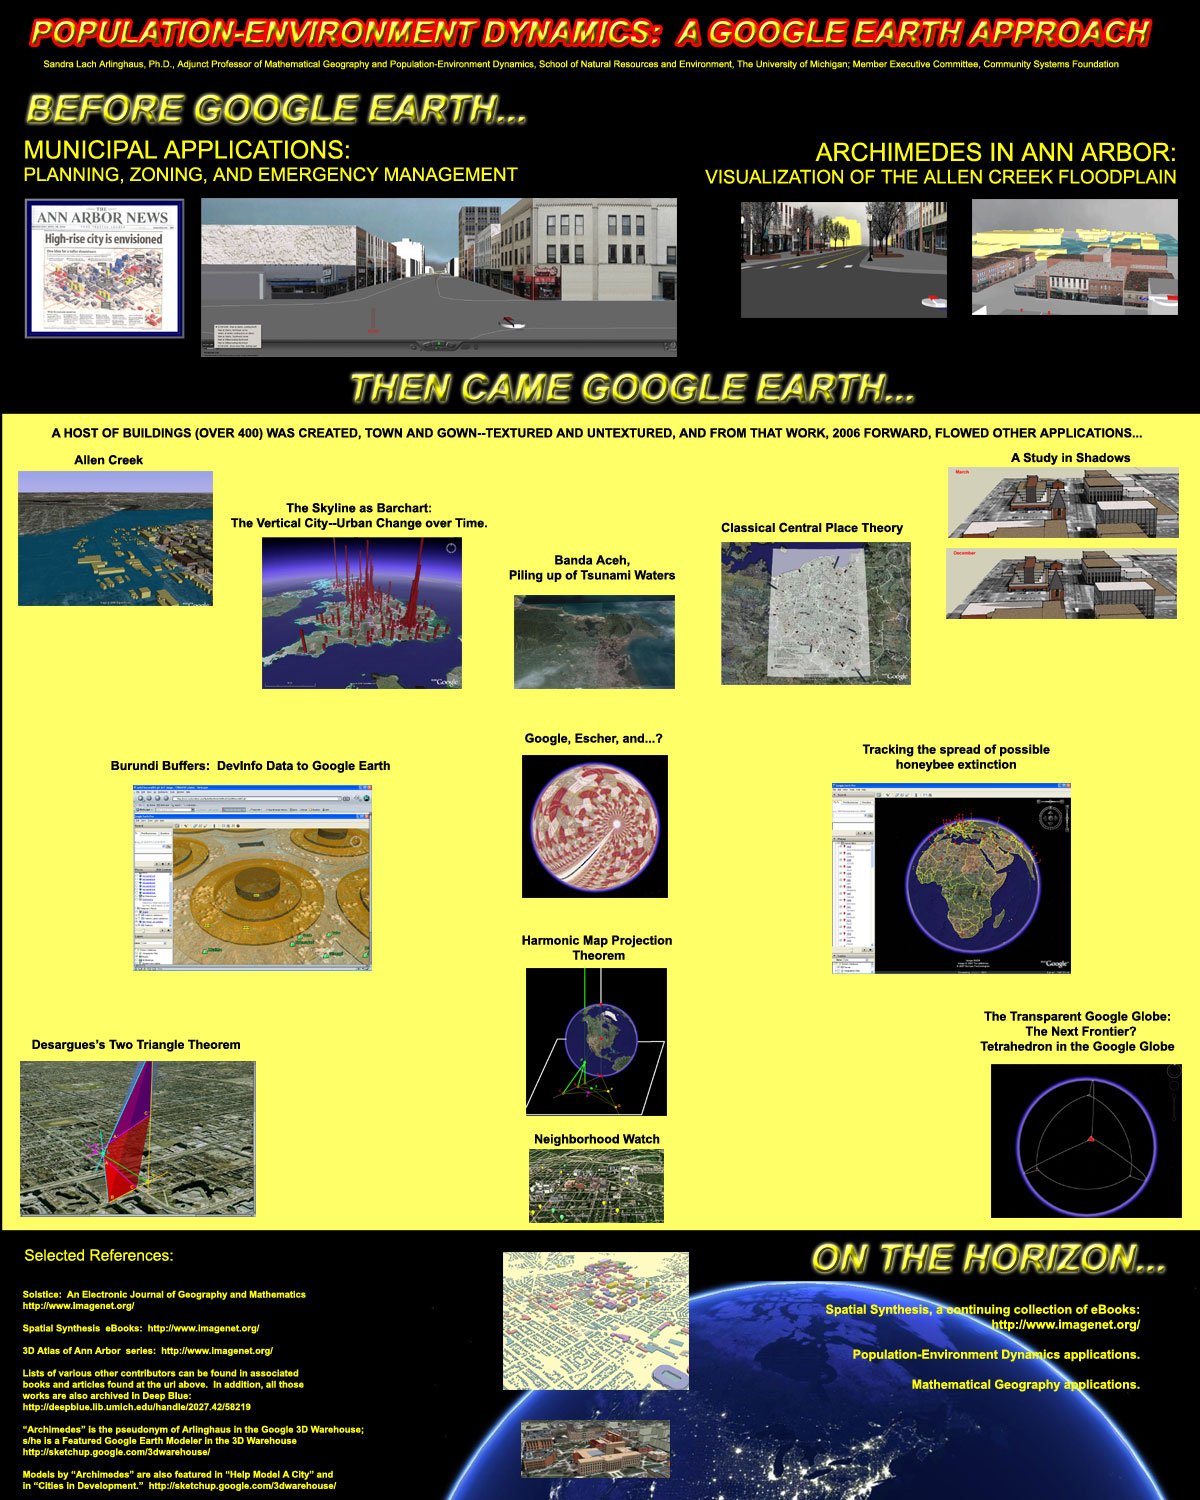
Figure
10. Poster
display involving the
transparent globe,
2008; link
to full-sized
clickable
poster. Original
source:
Institute of
Mathematical
Geography.
|
That too is an
interesting
question and
it is one that
is rooted in
mathematics
underlying the
transformation
of the surface
of the globe
to
plane.
The surface of
the sphere
cannot be
mapped, in a
one-to-one and
onto fashion
to the
plane.
There must
remain at
least one
point on the
sphere that
does not map
to the
plane.
Stereographic
projection
illustrates
this idea--all
but the north
pole is
projected into
the plane--the
image of the
north pole
goes to
infinity, as
Figure 11
suggests.
Figure
11.
Stereographic
projection. All
points on the surface of
the sphere may be
projected into the
plane, except one at the
north pole. Original
source:
Institute of
Mathematical
Geography.
|
I knew from
studying topology (Kelley,
1975), that the Alexandroff
Extension theorem provided
that inverse stereographic
projection produced a
one-point compactification
of the plane to the
sphere. The plane is
not compact; the sphere
is. Use inverse
stereographic projection to
suck the plane up to the
sphere. All of the
sphere except one point is
covered; add the one point
to make a compact
surface. So, I looked
to see where on the
continental skin there might
be a missing point and then
sought to, so to speak, put
my finger in it and stretch
it out with
transparency. The gap
sought seemed to be at the
south pole, and the way to
stretch seemed to be to use
the slider. It's odd,
sometimes, how mathematical
concepts can come into play
in unexpected ways! In
any event, it worked.
Does the procedure still
work today? Sadly, it
appears it does not; thus,
.kml files linked to earlier
materials do not work
either. The animations
made from those kml files do
continue to work, of
course. Perhaps the
one point has been sealed
up. Perhaps I do not
know where to look.
Current versions of Google
Earth, however, do not seem
to permit the removal of the
continental skin to reveal a
transparent globe. Other
software, such as
Google/Trimble SketchUp can
be
used to create a
sphere (using the
'Follow Me' tool) and
to create a
tetrahedron
(3DVinci.net)--but not
directly in the globe
(Figure
12).
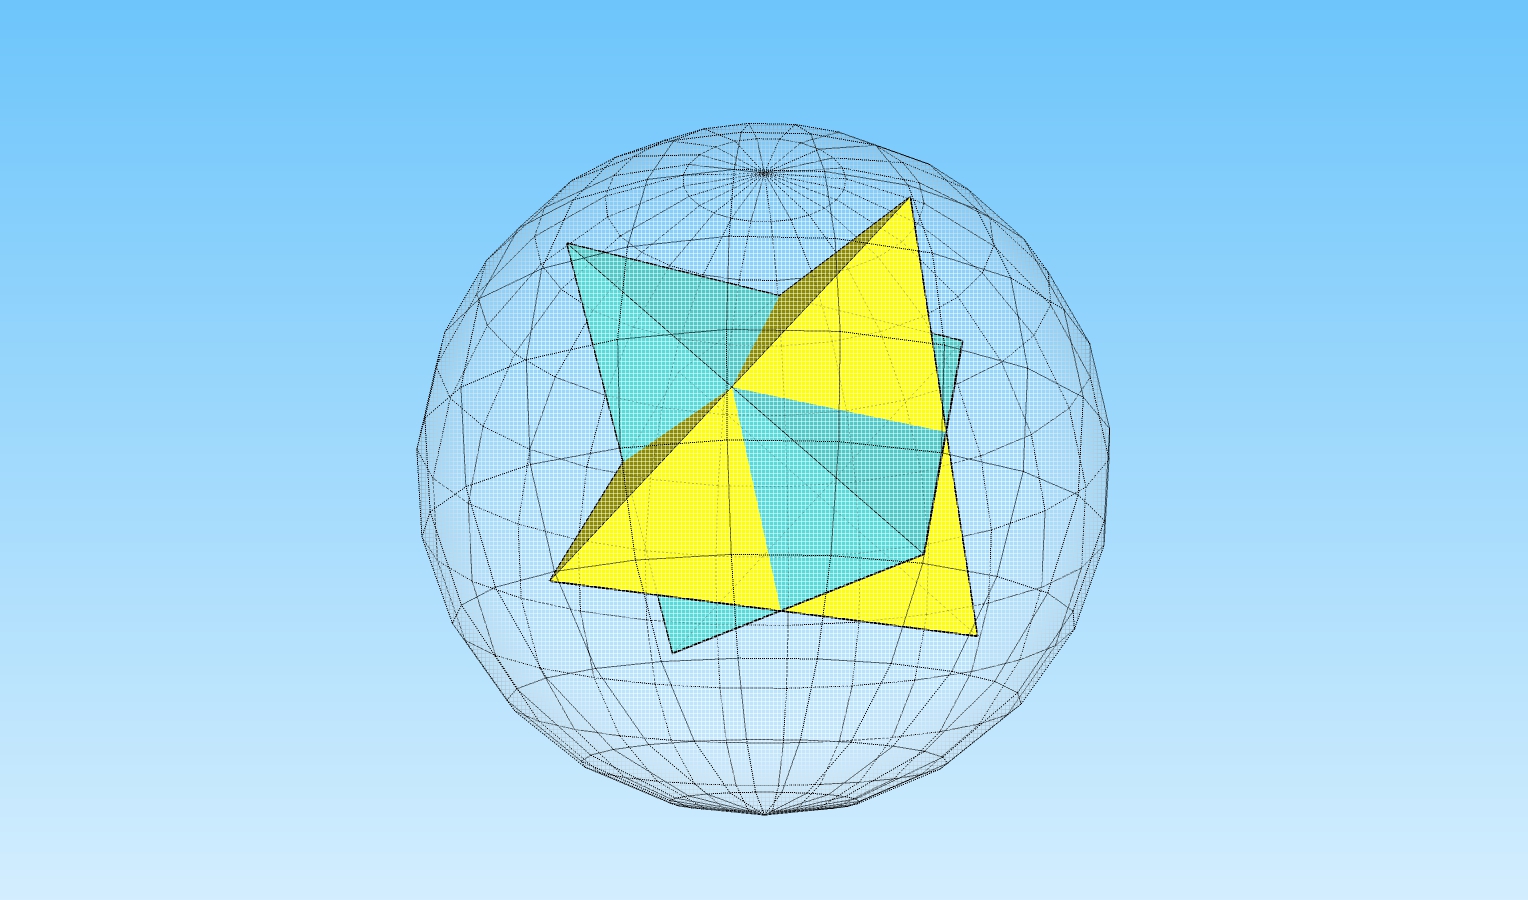
Figure
12. Two
intersecting
tetrahedra inside a
sphere.
|
Figure 12 illustrates
two intersecting
tetrahedra (or a
stellated
octahedron) inside
a sphere;
SketchUp suggests
interesting
alternatives,
although the
stellated
octahedron
cannot be embedded
inside
the globe
subject to the
constraint
that all
vertices lie
on landmasses
(1986).
However, the
capability to use
Google Earth directly,
to create a
tetrahedron embedded
in the
Earth-sphere, is
perhaps a bit
like
Barr himself--an
important memory from the
past that can help to
guide paths in the
future!
References
3DVinci.net. https://www.youtube.com/watch?v=3TWRvqVgCEI
Archives of American
Art. YouTube release,
2014. In
Celebration: David
Barr's Four Corners
Project.
Smithsonian Institution.
Arlinghaus,
Sandra L. 2009. The
Platonic Solids:
Earth-sculpture Anchored at
Easter
Island (Barr's
Condition). Solstice:
An Electronic
Journal of Geography
and Mathematics.
Volume
XX, Number 1.
Arlinghaus,
Sandra L. 2008.
Spatial
Synthesis.
Volume II, Book 2.
Making It
Clear: The
Importance of
Transparency.
Chapter:
"Escher/Barr Earth."
Ann Arbor:
Institute of
Mathematical
Geography.
Arlinghaus, Sandra L.; Barr, David;
and Nystuen, John D.
1991. "The Spatial
Shadow: Light and
Dark--Whole and
Part." Solstice:
An Electronic
Journal of Geography
and Mathematics.
Volume
II, Number 1.
Arlinghaus, Sandra L. and
Nystuen, John D.
1986. Mathematical
Geography and Global
Art: the
Mathematics of David
Barr's 'Four Corners
Project'.
Ann
Arbor: Institute
of Mathematical
Geography.
Kelley,
John L.
1975. General
Topology.
Berlin, New
York:
Springer-Verlag.
Michigan
Legacy Art Park.
2016. David
Barr Memorial.
|
In the In
|
|


