Lewis
and Clark, 200 Years: A Visual Tribute to an Exploration
The
Gates of the Rocky Mountains
Sandra
L. Arlinghaus, Robert J. Haug, and Ann E. Larimore
The
University of Michigan
The
historical texts of Meriwether Lewis, Captain United States Army, and William
Clark, Captain United States Army, offer the mind's eye a stunning visual
scene of explorers navigating a walled passage along the Missouri River,
through the Rocky Mountains, just upstream from what is now Great Falls,
Montana.
Use
of the historical and geographical record, coupled with current mapping
capability, permits the creation of visual scenes that might have confronted
Lewis and Clark at this unique site: The Gates of the Rocky Mountains.
We offer these images as a modest tribute to their spectacular exploration.
Note the differences that come from using different contour intervals (spacing
between successive contours).
Gallery
of Images
Digital
Elevation Models offer one view of the terrain. Digital Chart
of the World. Contour interval of 1000 feet. The Gates of the
Rocky Mountains are shown as a red dot.
The
Digital Chart of the World (from ESRI) offers contours at a 1000 foot contour
interval. Creation of a Triangulated Irregular Network from these
contours permits visualization of a chunky terrain and offers a general
context in which to consider the region. (Click on the small map
to see a larger map.) |
USGS
contours, Digital Elevation Model. Contour interval of 10 feet.
USGS
contours show a much more detailed picture than does the Digital Chart
of the World. |
Triangulated
Irregular Network created from the USGS DEM. |
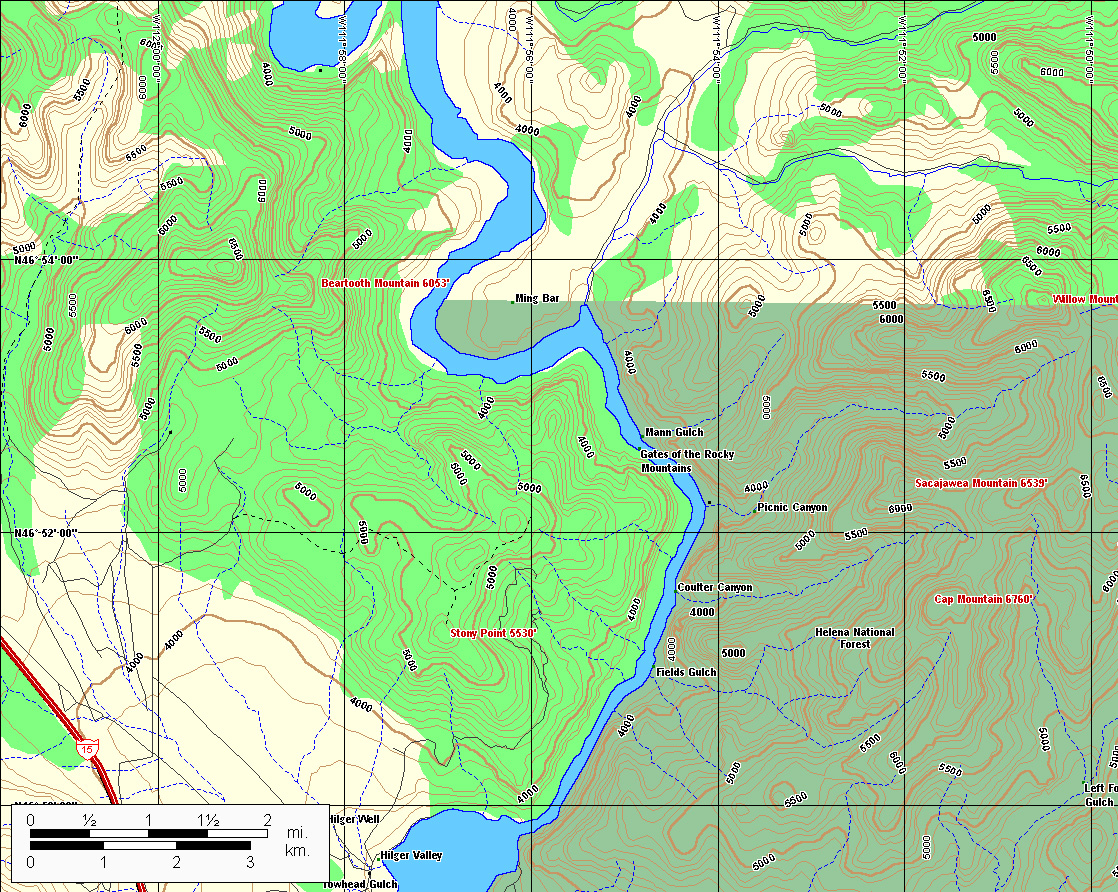
DeLorme
Topographic Atlas on CD: contour interval of 100 feet.
Scroll
to the right to see the full display. The Gates of the Rocky Mountains
are shown as a red dot.
Digitized
contours at the 100 foot contour interval level. |
Triangulated
Irregular Network made from digitized contours. |
Missouri
River superimposed in light cyan. |

The
Gates of the Rocky Mountains, red dot. |
Each
type of base topographic map has merits: the 1000 foot contour interval
map is useful, especially when represented as a TIN, as a general context
map. When the finest contour interval (10 feet) was used, the general
context was not evident. The TIN derived from the contour base shows
great detail. The 100 foot contour interval offers a balance between
the two. That map, however, was not a digitized map that would work
directly in a GIS (ArcView, ESRI). Thus, the contours were digitized
from the 100 foot base map, a TIN created from that base, and then the
TIN was put into ArcView 3D Analyst extension (ESRI) and saved as VRML
2.0, as a virtual reality of the scene. The much more highly detailed
USGS file renders a fine virtual reality scene; however, the size of that
file is over 177 MB and it causes many machines to crash. Thus, the
more modest file of 3 MB created from the 100 foot contour interval map
is included here. Readers should download (free) Cosmo Player from
http://ca.com/cosmo/
in order to view the virtual reality files directly in their internet browser.
Click
here
to see an animation of contours with superimposed TIN; The Gates of the
Rocky Mountains are shown as a red dot.
Click
here
to see the virtual reality scene of "The Gates of the Rocky Mountains"
derived from the 100 foot contour interval. |
What
else might illuminate historical and geographical texts of the future,
as an exploration in imaginative interactive communication and education?
One
might envision
-
creating
routes and scenes, defined by the user, in support of text. (See,
for example, the outstanding display created at the Department of Geography,
University of Missouri in the attached link)
-
taking
virtual voyages in canoes up the Missouri River as a search (using
a search function) of the landscape for animated local sentinels, all while
music of the period is playing in the background.
-
creating
a virtual Mandan village, as a way for present day Americans to view one
of the most important trading communities of the period.
Or,
one might look ahead to see student or research scouts forging ahead into
as yet unimagined connections between marvelous mapping advances and classical
texts from the past as history comes alive!
References
DeLorme,
Topographic Atlas on CD. http://www.delorme.com/
DeVoto,
Bernard. The Journals of Lewis and Clark with a foreword by Stephen
E. Ambrose, maps by Erwin Raisz. Mariner Books, Houghton Mifflin
Company (Boston and New York), original copyright 1953; current version,
1997.
Digital
Chart of the World. Environmental Systems Research Institute, http://www.esri.com/.
Lewis
and Clark Across Missouri, http://lewisclark.geog.missouri.edu/index.shtml
USGS,
EROS Data Center, http://edc.usgs.gov/geodata/
Copyright, 2003, Institute of Mathematical Geography.
All rights reserved.